Let’s discover the world of time series data with Stata. Matlab’s lovers, have a look at there.
Good morning Guys!
I am glad to announce that I moved forward to time series analysis. I will come back on econometrics sometimes but it feels good to vary a bit! Moreover, this topic is and will be a true challenge for me because, I must confess, I have always used Matlab to deal with time series data and I am now learning practically how to do the same in Stata. That is why I need you to read carefully what I write and correct me if there is any mistake! I can correct myself just if you help me so, please, do it.
Today I am going to start from the origins. We already know that, when dealing with panels, we must inform Stata what variables measure time and individuals in the sample. For time series is almost the same.
Today we are going to learn how to create a time variable, its lags, leads and differences.
Creating a Time Variable
A common issue we face when we manage time variables is that we must understand how to convert data from some other format, like a month-year string, into a single time variable. Your time variable should be an integer and usually should not have gaps between numbers.
If you don’t have a time variable in your data that are already in order and without gaps, you might create a year/quarter/day variable just typing:
gen year=1990+_n-1
In this way, we have created a new variable Year, which begins with 1990 in the first observation and increases by 1 thereafter.
Tip: Be careful with this operation. Your data should be properly sorted in the right order before!
If you want to create a quarter variable instead, you can type something like:
gen quarter=q(1990q1)+_n-1
This is a bit tricky! Indeed, we have created a variable that increases by 1 quarter in each observations but the result is an integer number increasing by 1 for each quarter (1990 quarter 2 is specified as 1, 1990 quarter 3 is specified as 2, etc).
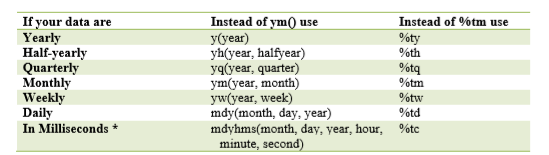
Another useful command in Stata is format. Format tells Stata to display values of one selected variable in a given format among those available. For example:
format quarter %tq
format day %td
NB: Please note that every syntax follows the same structure. You may use the w() for week, m() for month and h() for half-year functions. Inside the parentheses, you have to type a year followed by a separator (a comma, colon or word) followed by a second number that specifies the day, week, month or quarter of that year.
Time variable from Date string
If you have a string variable that describes the date for each observation and you want to convert it into a numeric format you can rely on Stata’s date conversion functions. You may say this is not widespread but trust me, several databank as World Bank provides data in a string format. So, this is what we can type:
gen time=daily(dstr, “mdy”)
format time %td
I just told Stata to create a variable time, starting from a variable “dstr” that contains dates like “Dec-25-2013” or “25-1-2013”. The “mdy” option tells Stata the ordering of the month, day and year in the variable. You can play with this option putting the order you prefer like “my”, “ymd” and so on.
gen month=monthly(strvar, “ym”)
format month %tm
You see? Straightforward!
NB: All these date functions require a way to separate the parts so date like “20150401” are not allowed.
What if you have a year variable and a month one and need to combine them to obtain a single time variable? Again, straightforward! Just type:
gen time=ym(year, month)
format time %tm
With these two formulas you have created a single time variable time from separate year and month variable and you have displayed the values in a format like “2015m5”.
Finally, you must declare your data as time series in order to use time-related commands. You are already familiar with the syntax:
tsset timevar // Tells Stata you have time series data with the time listed in the variable timevar.
Lags, Leads and Differences
In order to refer to past and future data, Stata has two useful commands that are L and F.
gen t=L.t
It creates the value of the variable t one unit of time ago. The value two units of time ago is L2.t where L stands for lag. Future values work the same with F.t F2.t ecc. Data must be sorted first, in order by time for time-series data.
If we want to create differences we just need to combine what we learnt:
gen diffInX= x – L.x or alternatively
gen diffInX=D.x
Tip: you can use these L. and F. notations directly in the list of variables for regression without creating them first.
reg gdp L.gdp L.unemployment L2.unemployment, vce(robust)
Time series and the egen command
We have already learnt several useful applications of the egen command here. What we do not know yet is that it can be applied to time series data in order to obtain mean and standard deviations for each year and/or group combined. Let’s observe it practically. Open again the dataset we used for Panel Data:
webuse nlswork
tsset idcode year, yearly
sort idcode year
Now I am going to generate the variables mean and standard deviation for the logarithm transformation of the wage, for each individual and year combined.
qbys idcode year: egen meanwage=mean(ln_wage)
qbys idcode year: egen sdwage=sd(ln_wage)
Another command you may want to learn is the one you find below. This creates a variable equal to 1 in a single observation for each individual-year combination, and 0 in all other observations.
egen useIt=tag(idcode year)
Tip: When you use the egen command, do not use “_n” or “_N” because these will cause to return meaningless results without a warning!
This is just an introduction on the topic. In a few days, I will discuss it more broadly, for now just get acquainted with this and be ready for the main course!
OMG.
Thanks alot i was about to cry when i found this blog , i am really struggling i have never ever dealt with STATA and know i found my self in the middle of no where trying to do things which i dont even know what is it.
now*
Dear Niema,
thanks a lot for your comment.
The real and true nature of my blog is exactly to be of help for people that are stuck on Stata and do not have an idea on how to perform several analysis. I can perfectly understand your feelings. I experienced the same in the last five to six years when I stumbled upon Stata and tried to figure how to solve my dilemmas on every influential source. I was looking for someone able to teach me which were the necessary steps in order to perform a regression in a clear and easy way. So, I helped myself at the end and I am glad I can be helpful for you.
If you have any feedback on what else I should cover or if there’s something I can improve, please don’t hesitate to write it down.
Best Regards,
Michela