It is not easy to approach for the first time a software like Stata if you do not know its graphic interface (GUI).
But still we have been quite lucky: in fact, Stata developers, StataCorp, decided to maintain the same simple graphic across all the different versions of the statistical software.
When you open Stata for the first time, this is what appears on your screen. As we can see, there are five different panels.
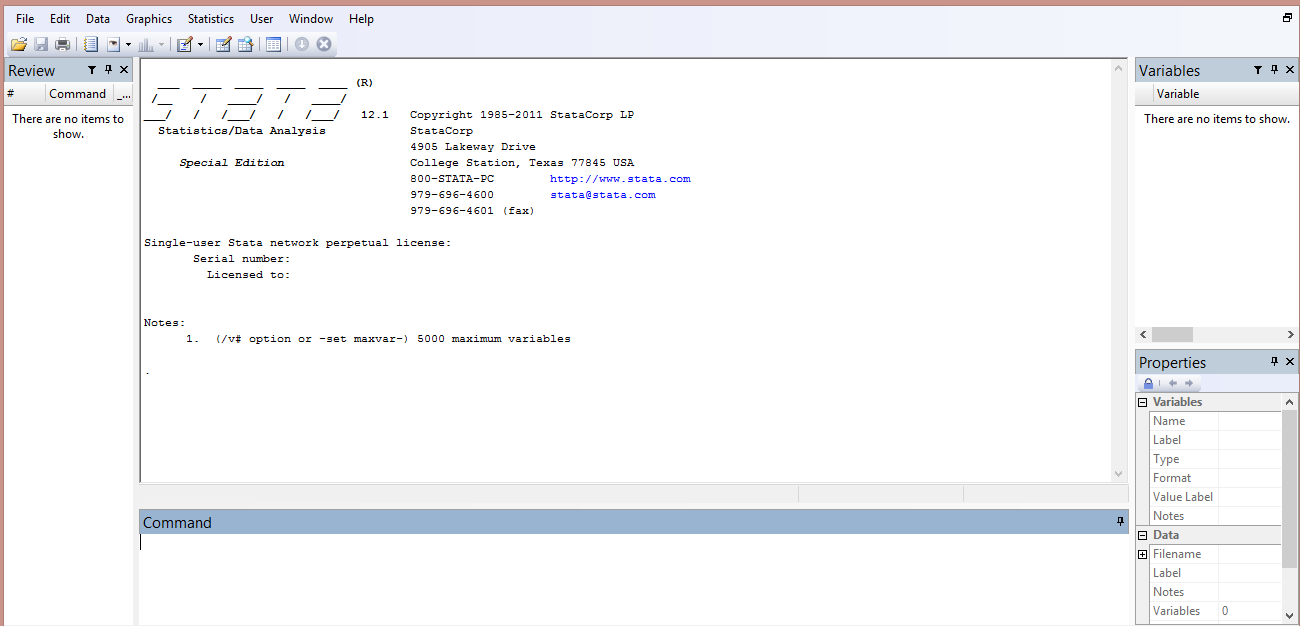
The main one in the center is the Results window. Here is where the output of your analyses appears.
Just underneath, there is the Command window where you can directly type commands in.
To the left is the Review window that shows your command history, from the first to the most recent one you typed during your Stata session.
To the right, is the Variables window. Here is where your variables’ names and label are displayed (when a database is opened, of course).
Finally, on the bottom panel on the right there is the Properties window. It is a summary you can use to manage your variables. Indeed, for each of them, their names, labels, value labels, notes, formats, and storage types are reported (Do not panic! I will explain to you in a new post what all this stuff means so, breathe on and keep it simple).
If you think you will not need one of these windows for your analysis, you can easily remove them from the screen by going on the menu and select Window.
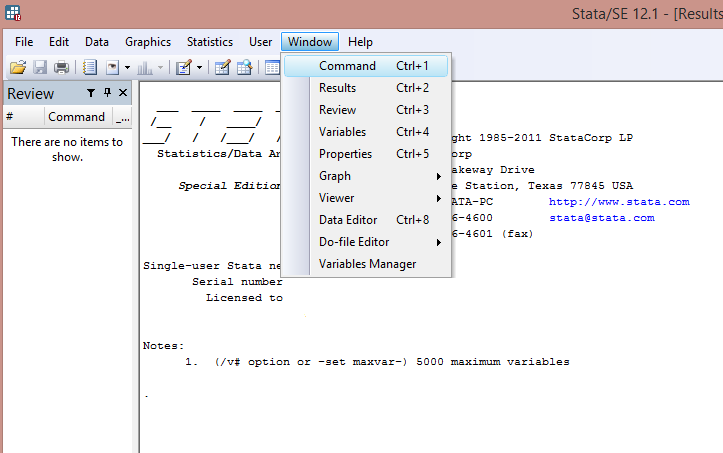
A top-down menu is displayed, which contains both the panels already described (Please notice that you can also directly remove them by typing Ctrl+1) and several other windows that are:
- Graph Editor: When you draw a graph in Stata, it opens in a separate window known as the Graph window. From there you can print the graph, copy it to the clipboard, and export it to formats such as PDF, EPS, PNG, and TIF. You can also edit every aspect of your graphs and save the edits in order to be apply them to all the graphs created in your Stata session.
- Viewer:The Viewer is where you use Stata’s help system. It displays results of your searches and it opens automatically if you type help in the Command If you need to know how a specific command works, you have to type it, i.e., help describe. The viewer will open immediately and provides you the description of the command and its syntax.
- Data Editor:This tool provides a live view onto your data. You can input data, copy-and-paste data (and preview data on the clipboard before importing it), and manage variables just as in the main interface. You can either open it in the “browse” mode, which locks down the Data Editor into a read-only one. Thus, you do not have to fear to press accidentally something that will change your data.
- Do-file Editor:This is the most important tool, I think. It is a new window where you can save a Stata file in a .do format (let’s call it do). In this file, you can write down all the lines of commands used so that you can recall them immediately anytime you open a new Stata session and launch them. It also displays several windows so that you can open more than one do-file at session.
- Variables Manager:This tool allows you to managing hundreds or thousands of variables, their names, labels, notes, and types.
Too much information to digest? Don’t worry, I will carefully go back on these features in the next posts.